The State of Peer-to-Peer Trailer Rental: 2026 Industry Snapshot
May 19, 2026 97 16 min read Industry Report
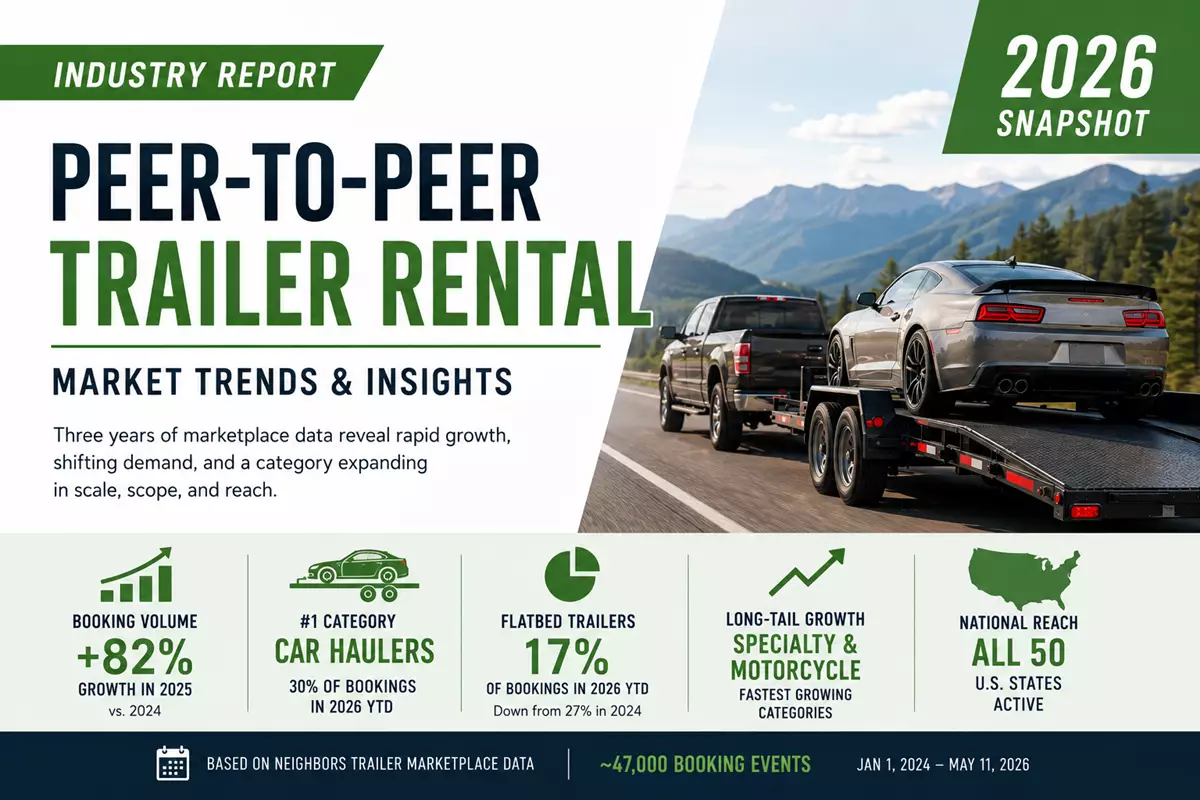
Peer-to-peer trailer rental is in early-stage rapid growth. Platform booking volume nearly doubled year-over-year in 2025, and 2026 is on pace for another year of strong expansion. The demand mix has shifted meaningfully: car haulers have emerged as the #1 most-rented category, flatbed trailers have lost roughly a third of their mix share since 2024, and long-tail categories (motorcycle, specialty) are growing the fastest from small bases. Geographic concentration is real, with the top five states accounting for nearly half of lifetime bookings, but the platform is active in all 50 U.S. states. This report draws on three years of Neighbors Trailer marketplace data covering roughly 47,000 booking events through May 11, 2026.
Executive Summary
This is the first published industry analysis of peer-to-peer trailer rental as a distinct category within the sharing economy. The findings draw on three years of marketplace data from Neighbors Trailer, the largest peer-to-peer trailer rental marketplace in the United States and Canada.
The headline findings:
- Booking volume grew 82% year-over-year in 2025, with 2026 year-to-date pace running 60%+ ahead of the same period in 2025
- Car haulers are now the dominant rental category at 30% of bookings, with the gap over the #2 category continuing to widen
- Flatbed trailers, which were tied for #1 in 2024 at 27% mix share, have declined to 17% in 2026 year-to-date, roughly a one-third reduction in mix share over 18 months
- Long-tail categories (specialty trailers, motorcycle trailers) are growing fastest from small bases, signaling a broadening of platform use cases
- Geographic concentration is real: the top five states account for 46% of lifetime bookings, the top ten for 73%
- Seasonality is pronounced: Q3 represents roughly 31% of annual volume, Q1 about 16%
For the full context behind each finding, including methodology and what these patterns mean for the category, the sections below provide the detail.
Methodology
All findings in this report draw on platform data from Neighbors Trailer, covering January 1, 2024 through May 11, 2026.
Two primary data sources informed the analysis:
- Trailer-type booking reports for full-year 2024, full-year 2025, and 2026 year-to-date (through May 11). These reports count all booking events created on the platform, including bookings that completed, were rejected, were cancelled, or experienced payment processing issues. Combined, these reports cover 46,639 booking events.
- Cumulative geographic data from the platform's Reports Center, snapshot as of May 12, 2026. This provides booking and revenue distribution by state and by city for the platform's lifetime to date.
Important methodological notes:
- Booking volume figures reflect USA and Canada combined activity. Geographic concentration figures reflect USA only, as the underlying data is structured by country.
- Growth percentages are computed from the most consistent available data source for each comparison. The trailer-type booking reports are the canonical source for year-over-year volume comparisons.
- Reported booking counts include all booking events regardless of outcome (some studies in adjacent categories report only completed rentals; this report uses the broader convention).
- The lifetime-to-date figures in geographic sections capture marketplace activity through May 12, 2026.
- Neighbors Trailer has operated since 2022. This report focuses on 2024 through 2026 because that period reflects the platform at meaningful operational scale and uses consistent reporting definitions. Earlier years had lower volume and different reporting structures, which would not support clean trend comparison.
This methodology is documented in detail in the appendix at the end of this report.
1. Growth: The Category Is Doubling Annually

Peer-to-peer trailer rental as a category is in early-stage rapid growth.
Booking volume more than doubled in 2025. Marketplace booking events grew 82% year-over-year from 2024 to 2025, reflecting both a deepening of demand within existing user cohorts and a broadening of the addressable market as more renters discover peer-to-peer alternatives to traditional rental yards.
2026 is on pace for another year of strong growth. Through May 11, 2026, the platform has processed approximately 60% more booking volume than in the same period in 2025. If this pace continues through the rest of the year (which would require Q3, historically the peak quarter, to maintain trajectory), 2026 will end as another year of 60%+ growth. Q3 has not yet entered the data; if booking patterns accelerate into the seasonal peak, the full-year figure could push higher.
Demand momentum has been particularly strong in Q2 2026. May 2026 has shown notable strength, with daily booking activity outpacing prior periods and a wave of new bookings, many of them for future-dated rentals that will recognize revenue in subsequent months.
What's behind the growth? A few factors appear to be contributing:
- Increased renter awareness of peer-to-peer rental options for trailers, mirroring patterns seen in adjacent sharing-economy categories (vehicle rental, vacation rental, equipment rental)
- Geographic expansion as more owners list trailers in more states
- Category diversification within trailer types, allowing renters with specific needs to find appropriate equipment that traditional rental yards may not stock
- Repeat usage: roughly one in four renters returns for a subsequent rental
How does this compare to other sharing-economy categories at similar stages? Direct comparisons are difficult because each platform discloses different metrics, but the year-over-year doubling is broadly consistent with what other categories experienced in their early years. Vehicle-rental marketplaces, vacation-rental platforms, and equipment-rental marketplaces all experienced multi-year periods of 50% to 100%+ annual growth before maturing into steadier mid-double-digit growth patterns. The trailer-rental category appears to be in the early phase of that arc.
2. Category Mix: Car Haulers Are Now the #1 Rented Category

The single most striking finding in three years of marketplace data is how much the demand mix has shifted.
Car haulers have become the dominant category. In 2024, car haulers and flatbed trailers were effectively tied for the most-rented category, at roughly 27% each. By 2026 year-to-date, car haulers have grown to 30% of bookings, while flatbed has declined to roughly 17%. The gap is now substantial, and the trajectory is continuing.
The full category mix evolution:
| Trailer Type | 2024 Share | 2025 Share | 2026 YTD |
|---|---|---|---|
| Car Hauler | 27.0% | 30.3% | 30.1% |
| Flatbed | 26.9% | 18.9% | 16.8% |
| Enclosed | 24.4% | 24.4% | 21.2% |
| Utility | 11.0% | 13.2% | 15.3% |
| Dump | 6.3% | 7.4% | 6.8% |
| Specialty | 0.1% | 1.0% | 3.0% |
| Motorcycle | 0.2% | 0.8% | 2.4% |
| Horse | 3.6% | 3.4% | 2.7% |
| Boat | 0.3% | 0.8% | 0.7% |
| Tow Dolly | 0.1% | 0.2% | 0.5% |
Three patterns emerge from this evolution.
Pattern 1: Car Hauler ascendance. Car hauler bookings reflect a specific use case, typically the movement of a non-driveable vehicle from point A to point B. Auction pickups, collector car shows, track day transport, inoperable vehicle moves, and cross-country relocations with a second vehicle in tow. The growth in this category suggests that vehicle-moving demand has found peer-to-peer trailer rental as the natural fulfillment channel, possibly displacing flatbed truck rentals and dedicated transport services for the smaller, occasional jobs.
Pattern 2: Flatbed share decline. Flatbed trailers are general-purpose workhorses serving construction, landscaping, equipment hauling, and miscellaneous oversized loads. The category did not shrink in absolute terms (flatbed bookings continued to grow each year), but every other major category grew faster, pulling share away from flatbed. The likely explanation: flatbeds were the natural first choice for early P2P renters who were not sure what they needed. As the platform matured, renters with more specific needs found more specific trailer types.
Pattern 3: Long-tail emergence. Specialty trailers grew from 0.1% of bookings in 2024 to 3.0% in 2026 YTD, a 30x increase in mix share. Motorcycle trailers grew similarly. These are categories that barely existed on the platform two years ago. Their growth signals that peer-to-peer trailer rental is being adopted as a category-defining marketplace for all trailer types, not just the major four.
Utility and dump trailers also gained share, though more modestly. Utility trailers grew from 11.0% to 15.3%, the largest absolute share gain of any category, reflecting strong adoption by weekend homeowners. Dump trailers grew from 6.3% to 6.8%, with absolute booking volume more than doubling in 2025, suggesting that working contractors and landscaping professionals have begun using the platform regularly.
3. Geographic Concentration: Five States, Half the Demand

Marketplace activity is concentrated in a relatively small number of states.
Top five states account for 46% of lifetime bookings:
| Rank | State | Share of Lifetime Bookings |
|---|---|---|
| 1 | Texas | 17.4% |
| 2 | Florida | 13.1% |
| 3 | California | 10.9% |
| 4 | Colorado | 6.4% |
| 5 | North Carolina | 6.0% |
Top ten states account for 73% of lifetime bookings. Beyond the top five, the next five include Virginia, Georgia, Arizona, Michigan, and Ohio. The remaining 27% of bookings are spread across 40 additional states plus territories.
Why this matters. Geographic concentration is the norm for early-stage marketplaces. Airbnb's early years were heavily concentrated in San Francisco and New York. Turo's early growth was concentrated in California and Florida. The pattern is not unique to trailer rental; it reflects how marketplaces build supply and demand in parallel, typically starting in a few high-density geographies before expanding.
What's behind the concentration:
- Texas is the largest state by population in the platform's primary markets and has a culture of trailer ownership tied to ranching, hunting, oilfield work, and motorsports. These factors support both supply (owners willing to rent) and demand (renters comfortable with trailers).
- Florida has high recreational vehicle activity, an active classic car community, and significant equipment-rental demand from construction and landscaping.
- California has scale-driven volume (sheer population) combined with strong specialty markets (collector cars, motorsports, recreational vehicles).
- Colorado and North Carolina punch above their population weights, suggesting strong supply growth and renter adoption in these states relative to their size.
City-level concentration is tighter than state-level. The top 25 cities by lifetime bookings collectively account for approximately 17% of platform volume. This means most state-level booking activity occurs outside the top metro areas, which is a healthy sign of geographic distribution within high-volume states.
Revenue concentration follows a similar pattern. Texas leads on lifetime gross marketplace value, followed by Florida, California, and Colorado. Average rental value varies meaningfully by state. Rentals in some lower-volume states have higher average ticket sizes, reflecting longer rental durations and higher-value trailer types (specialty, equipment, gooseneck).
The implication for the category. While concentrated today, the platform's activity in all 50 states indicates that peer-to-peer trailer rental has national reach. The growth opportunity within underpenetrated states (particularly the Midwest, the Mid-Atlantic, and the Pacific Northwest) is substantial.
4. Seasonality: H2 Drives the Year

Peer-to-peer trailer rental demand is meaningfully seasonal, with a pronounced summer-and-fall peak.
2025 quarterly booking distribution:
| Quarter | Share of Annual Volume |
|---|---|
| Q1 (Jan to Mar) | 15.6% |
| Q2 (Apr to Jun) | 24.8% |
| Q3 (Jul to Sep) | 31.0% |
| Q4 (Oct to Dec) | 28.7% |
The H2 peak is consistent across years. In 2024, Q4 led at 31.2% of annual volume with Q3 close behind at 30.6%. In 2025, the order flipped, with Q3 at 31.0% and Q4 at 28.7%. Across both years, Q3 and Q4 combined consistently represent the majority of annual booking volume, while Q1 is consistently the weakest quarter.
What drives the seasonality:
- Summer construction and landscaping season drives flatbed, dump, and utility trailer demand
- Summer move season drives enclosed cargo and car hauler demand for relocations
- Summer recreational activity drives motorcycle, boat, and specialty trailer demand
- Auction and collector car season (typically spring through fall) drives car hauler demand
- Winter weather in northern states suppresses Q1 demand, particularly for open-deck trailer types
Q4 holds up better than Q1. Q4 is consistently the second-highest or highest quarter, primarily because October and November still have significant outdoor activity in southern states, and December has end-of-year vehicle relocations and holiday-related moves. Q1 (particularly January and February) is the slowest period of the year across all categories.
The implication for owners and renters. Owners who list their trailers will see higher booking volume in Q2 through Q4 than in Q1, with the corresponding pricing dynamics that follow from seasonal demand patterns. Renters planning summer projects should book earlier in the season, as availability tightens in July and August.
5. What the Data Says About Where the Category Is Going
Three years of marketplace data point to a few directional conclusions about the peer-to-peer trailer rental category in 2026 and beyond.
1. Use-case diversification is the leading growth indicator. The platforms that grow fastest in the sharing economy are usually the ones that capture more distinct use cases over time. Airbnb went from couch-sharing to vacation rentals, business travel, monthly stays, and luxury rentals. Turo went from car-sharing to fleet operators, specialty vehicles, and longer-duration rentals. The trailer-rental category appears to be in the early phase of this arc: the same platform serving a broadening set of distinct rental jobs (vehicle moving, equipment hauling, recreational, working contractor, weekend homeowner).
2. The "homeowner with mulch" stereotype is outdated. The default mental image of trailer rental is a weekend homeowner hauling yard waste. The data tells a different story. The single most-rented category is car haulers. The fastest-growing categories include dump trailers, which more than doubled in absolute volume in 2025 and serve working contractor demand. The category is professionalizing and broadening in parallel.
3. Category mix evolution may be more informative than total growth. Most industry growth headlines focus on total volume: bookings up X%, revenue up Y%. Those numbers matter. But for a category in early growth, the shape of the growth (which use cases are gaining and which are stable) tells you more about where the market is going than the topline numbers alone. The Flatbed-to-Car-Hauler shift visible in the 2024 to 2026 data is a structural signal about how the category is finding its center of gravity.
4. Geographic expansion is the next chapter. The current concentration in five states (representing 46% of volume) reflects where peer-to-peer trailer rental has gained traction first. The platform's presence in all 50 states, combined with growth in previously-underpenetrated states like Colorado and North Carolina, suggests the next phase will be deeper penetration outside the top markets.
5. Trust and verification infrastructure matter more as the category professionalizes. As more use cases enter the platform, particularly working contractor rentals where the trailer is used for commercial purposes, the importance of identity verification, motor vehicle record screening, and protection coverage increases. The category's continued maturation will likely involve deepening these trust layers, consistent with the broader pattern seen in adjacent sharing-economy categories.
Frequently Asked Questions
How many bookings has Neighbors Trailer processed?
The platform has processed approximately 47,000 booking events across 2024, 2025, and 2026 year-to-date through May 11. This includes all booking requests created on the platform, regardless of outcome.
Is peer-to-peer trailer rental profitable?
Peer-to-peer trailer rental as a category is in early-stage rapid growth, with platform booking volume nearly doubling annually. As with most sharing-economy marketplaces in their early years, the focus is on supply expansion, demand acquisition, and trust infrastructure rather than near-term profitability.
What's the most popular type of trailer to rent?
Car haulers are the most-rented category, accounting for roughly 30% of platform bookings in 2026. Enclosed cargo trailers are second at roughly 21%, and flatbed trailers third at roughly 17%.
Which states have the most peer-to-peer trailer rental activity?
Texas leads in both booking volume and revenue, followed by Florida, California, Colorado, and North Carolina. These five states account for approximately 46% of lifetime platform bookings.
How does peer-to-peer trailer rental compare to traditional rental yards?
Peer-to-peer platforms offer a wider variety of trailer types (the Neighbors Trailer marketplace lists seven major categories plus specialty sub-types), more geographic distribution (rural and suburban areas often have limited traditional yard options), and pricing dynamics that reflect local supply rather than corporate rate cards. Traditional rental yards typically offer more standardized inventory and the convenience of established locations.
What's driving the growth in 2026?
Growth in 2026 reflects several factors: continued category awareness among renters new to peer-to-peer rental, geographic expansion as more owners list trailers in more states, and use-case diversification within trailer types. Q2 2026 has shown particular momentum, with strong daily booking activity in May.
Are these findings representative of the broader peer-to-peer trailer rental category?
The findings draw on Neighbors Trailer marketplace data. As the largest peer-to-peer trailer rental marketplace in the United States and Canada, the platform's data is the most comprehensive single-source dataset on the category. The findings should be interpreted as representative of the broader category, though local variations may exist.
Methodology Appendix
For readers interested in the methodological details:
Booking volume figures are sourced from the Neighbors Trailer Trailer-Type Booking Report, which counts all booking events created on the platform during a given period. Booking events include completed rentals, cancelled rentals, rejected rentals, and rentals that experienced payment processing issues. This is a broader definition than "completed rentals only" but is the standard convention for sharing-economy marketplace reporting (e.g., Airbnb publishes "nights booked" which includes cancellations).
Geographic data is sourced from the Neighbors Trailer Reports Center API, lifetime cumulative snapshot as of May 12, 2026. This includes all marketplace activity from platform inception through the snapshot date.
Year-over-year growth percentages are computed using the Trailer-Type Booking Report as the canonical source. The report covers USA and Canada combined.
Repeat-customer rate is sourced from the Reports Center lifetime customer analytics tab.
Seasonal patterns are derived from quarterly booking distributions in the Trailer-Type Booking Report.
This report does not include:
- Owner-side economic data (lifetime owner earnings distributions, retention rates, and so on); held for future reporting
- Sub-category analysis within major trailer types (for example, 7x14 vs 6x12 utility trailer demand)
- Specific dollar-value figures for revenue, GMV, or platform commission
- Conversion-funnel data; held for future reporting once supporting infrastructure is fully mature
Data integrity notes:
Several different reporting tools within the Neighbors Trailer platform classify bookings using different definitions. The figures in this report are sourced consistently from the report types specified above, but readers should be aware that booking counts from other platform reports may differ due to varying filter definitions. The methodology used here is documented to enable comparison with future reports.
Further Reading
- Best Trailer Type for Each Job: A Quick Picker
- Renting vs. Buying a Trailer: A 2026 Cost Comparison
- How Peer-to-Peer Marketplaces Vet Users: Inside the Trust Stack
- Trailer Theft Is Up: How to Protect Your Trailer in 2026
Ready to participate in the market?
- Looking to rent a trailer? Browse trailers near you: utility, flatbed, enclosed, car hauler, dump, and specialty.
- Have a trailer that sits idle? List it on Neighbors Trailer and turn idle capacity into income.
- Building, writing, or analyzing in this space? Contact us at service@neighborstrailer.com for additional context or data inquiries.
About the data
This report draws on Neighbors Trailer's internal marketplace reporting. Neighbors Trailer is the largest peer-to-peer trailer rental marketplace in the United States and Canada, operating since 2022, with active marketplace activity across all 50 U.S. states and Canadian provinces. The platform connects trailer owners with renters across seven major trailer categories (utility, flatbed, enclosed cargo, car hauler, dump, motorcycle, and horse trailers) plus a growing specialty category covering tow dollies, boat trailers, and other long-tail types.
For data licensing, citation requests, or additional inquiries, contact service@neighborstrailer.com.